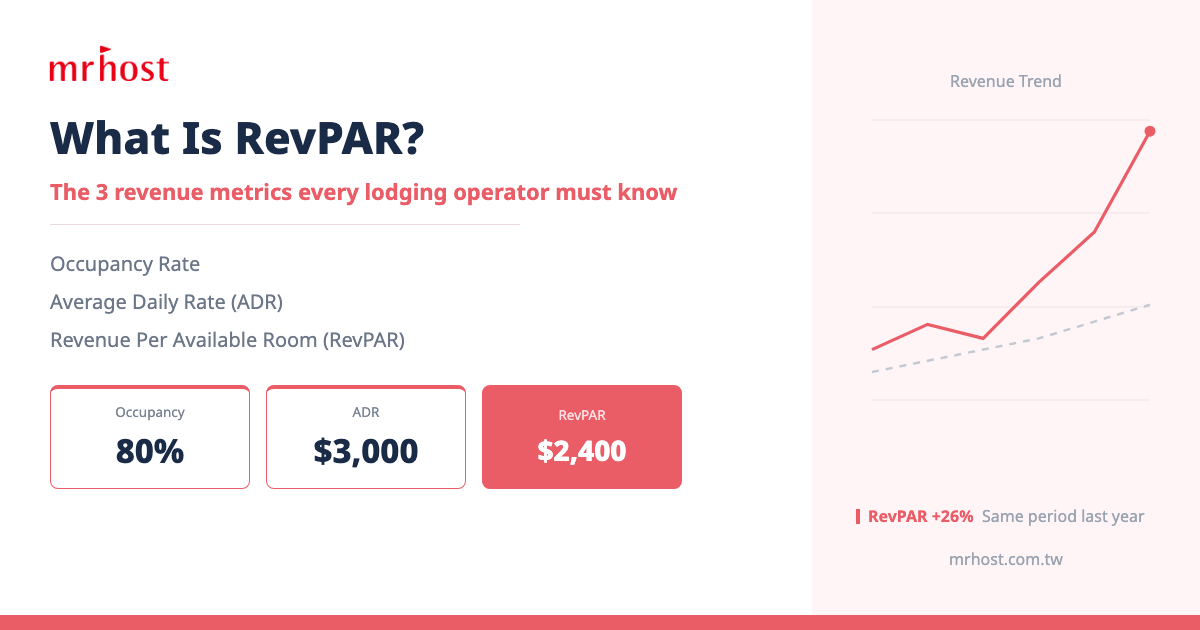
RevPAR (Revenue Per Available Room) is one of the most important metrics for measuring lodging performance. It is calculated as "total room revenue ÷ number of available rooms", or "Average Daily Rate (ADR) × Occupancy Rate". RevPAR reflects both pricing power and occupancy, making it the core number for judging how healthy a property's revenue really is.
1. Why do lodging operators need to understand these metrics?
Many operators judge how business is doing by "how many rooms we booked today" or "how much revenue this month". These numbers are intuitive, but they have a blind spot——they can't tell you whether you are truly maximizing the value of every room.
Revenue management has three core metrics that help you diagnose your property more precisely: Occupancy Rate, Average Daily Rate (ADR), and Revenue Per Available Room (RevPAR).
2. The three core metrics explained
Metric 1: Occupancy Rate
Definition: The proportion of rooms actually sold out of total available rooms within a given period.
Formula:
Occupancy Rate = Rooms Sold ÷ Available Rooms × 100%
Example: A guesthouse with 20 rooms sells 16 on a weekend, giving an occupancy rate of 80%.
What this number tells you: High occupancy means guests are choosing you, but it doesn't mean you're earning more——if the room rate is too low, high occupancy can actually mean selling at a loss.
Metric 2: Average Daily Rate (ADR)
Definition: The average price per room sold within a given period.
Formula:
ADR = Total Room Revenue ÷ Rooms Sold
Example: Over the same weekend, 16 rooms brought in a total of NT$48,000, giving an ADR of NT$3,000.
What this number tells you: ADR reflects your pricing power. A low ADR may mean your rates aren't aggressive enough, or that your promotional discounts are too deep.
Metric 3: Revenue Per Available Room (RevPAR)
Definition: Combining occupancy rate and average daily rate, it is the single most important metric for measuring a property's overall room revenue efficiency.
Formula:
RevPAR = ADR × Occupancy Rate
or
RevPAR = Total Room Revenue ÷ Available Rooms
Example: ADR NT$3,000 × Occupancy Rate 80% = RevPAR NT$2,400
What this number tells you: RevPAR is the most comprehensive metric. Two properties may each be higher or lower on ADR and occupancy, but the one with the higher RevPAR has better overall room revenue efficiency.
3. How the three metrics relate and apply
These three metrics only become meaningful when viewed together:
| Situation | Occupancy | ADR | RevPAR | Possible Problem |
|---|---|---|---|---|
| Selling a lot but earning little | High | Low | Mid | Rates set too low; pricing needs to be raised |
| High rates but rooms not selling | Low | High | Mid | Needs promotion or a shift in target audience |
| Both poor | Low | Low | Low | Operational capability needs review |
| Ideal state | High | High | High | Revenue management strategy is working |
Key takeaway: The goal of revenue management is not to "chase occupancy alone" or "chase high rates alone", but to find the balance point that maximizes RevPAR.
4. How to use these metrics to improve your lodging business?
Step 1: Establish baseline numbers
Start by reviewing your property's occupancy, ADR, and RevPAR over the past 12 months—this is your baseline.
Step 2: Identify where the problem lies
- Low occupancy but reasonable ADR → an exposure or conversion problem; optimize OTAs and other sales channels
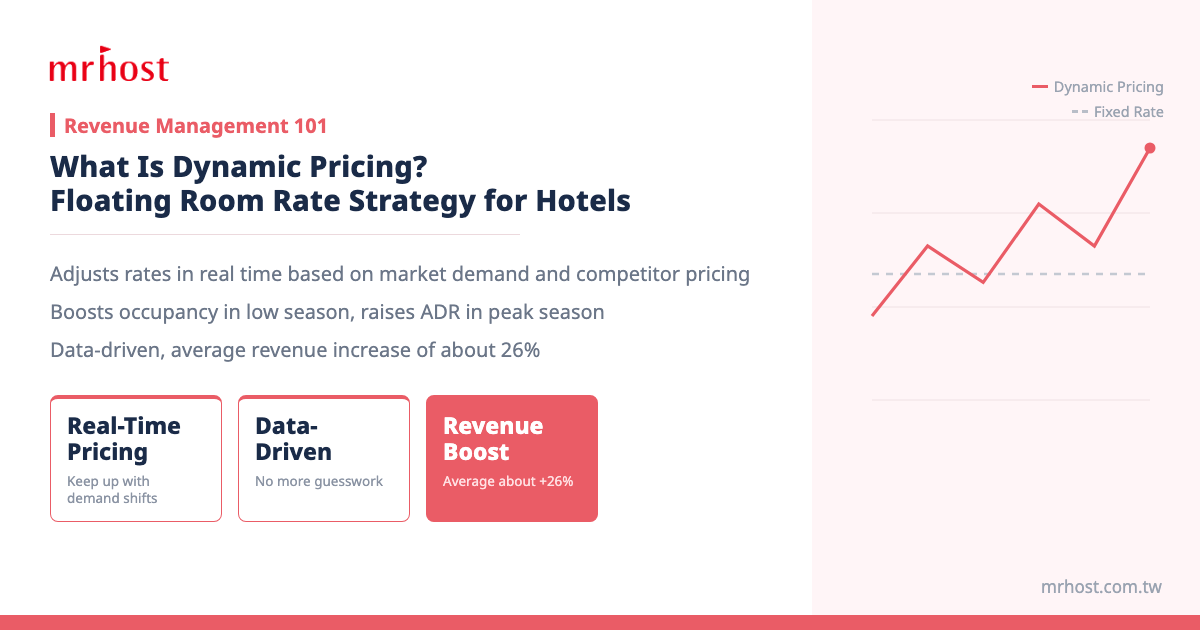
- High occupancy but low ADR → pricing is too conservative; try dynamic pricing
- Overall low RevPAR → you need to flexibly adjust your pricing strategy or review operational capability
Step 3: Compare with competitors
Looking at your own numbers alone isn't enough. After taking 1. location, 2. hardware and service level, and 3. operational capability together into account, find properties with conditions similar to yours for comparison, so you understand what options guests have when booking and whether they would choose you.
Step 4: Track changes regularly
We recommend checking these three numbers at least once a week, and doing an in-depth analysis once a month, comparing low and peak seasons and the differences between platforms.
FAQ
Q: What counts as a good RevPAR?
A: There is no absolute standard for good or bad. It only becomes meaningful when compared with properties that match in 1. location, 2. hardware and service level, and 3. operational capability. What matters is tracking whether your own RevPAR stays within a reasonable range.
Q: How is RevPAR different from total revenue?
A: Total revenue is an absolute amount affected by the number of rooms; RevPAR is a relative efficiency metric that removes differences in property size, making it more suitable for comparing different properties or evaluating the effect of a strategy.
Q: Is 100% occupancy the best?
A: Not necessarily. If 100% occupancy is achieved by pushing rates down, RevPAR may actually be worse than at 85% occupancy with higher rates. The optimal occupancy depends on the property's location and market conditions; applying dynamic pricing across low and peak seasons leads to better ADR and RevPAR performance.
Q: Do OTA platforms provide this data?
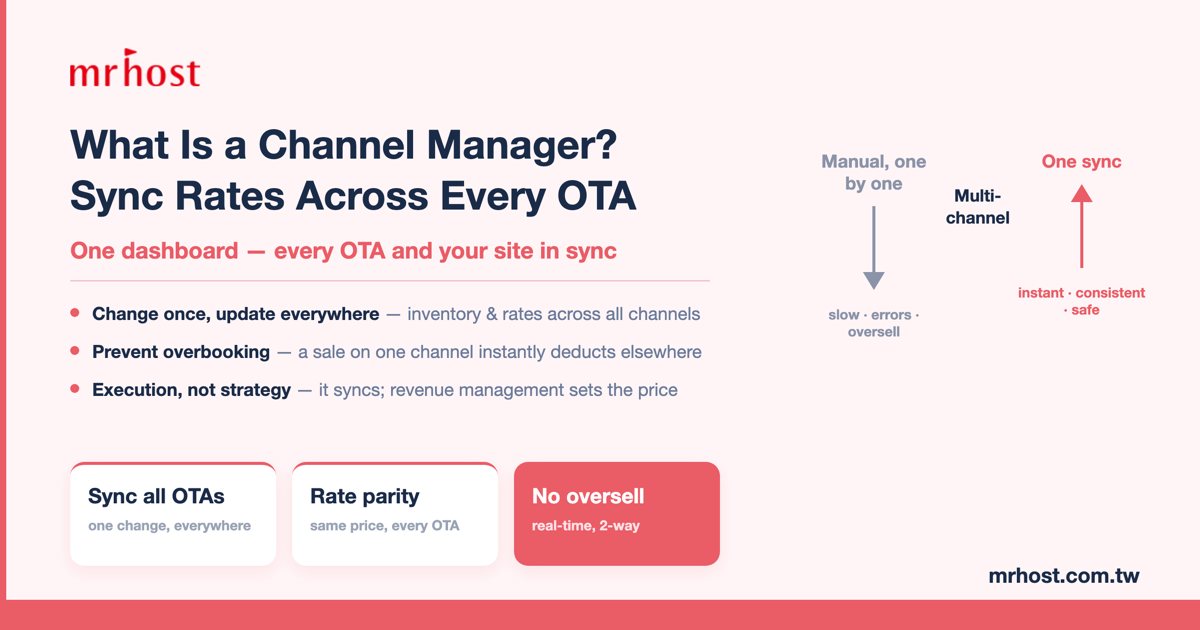
A: Every OTA back end provides data, but because information isn't integrated across platforms and doesn't include your own website or direct bookings, it's harder to analyze.
Q: Do small guesthouses also need to track these metrics?
A: For guesthouses with few rooms, setting prices too high so rooms don't sell, or too low so revenue is missed, has an even greater impact on the owner—so regularly tracking the surrounding market is essential.
This article was written by the mrhost revenue management team. mrhost provides lodging revenue management consulting services, helping hotel and guesthouse owners across Taiwan and the Asia-Pacific region grow revenue and competitiveness.